Welcome to DrDebug
DrDebug is a custom C++ Look-Dev suite that bypasses UE5's native limitations to give you the mathematical ground truth of your pixels. No more fake masks. No more relying on broken view modes.
Where do you need to go?
1.0 - Quick Start & Installation
For Indie & Personal Licenses, When you download DrDebug, choose the right version for your Engine, Drop the "DrDebug" folder in
X:/YOUR_PROJECT/Plugins/
Enable the plugin in The Editor, Restart the engine. You're done, you'll find it in the Editor Modes Menu, same as Landscape, Foliage Modes...
As soon as you switch to another Editor Mode, the Plugin is no longer active & will have no trace whatsoever on your game/project

For AAA/AA studios using custom engine builds: Drop the provided source code into your Plugins folder and compile your project normally.
2.0 - Understanding the UI
Each number of the photo will be a sub-part of this section

2.1 - Toolbar
Starting from Left to right to explain how the elements of the toolbar work properly.
- The Pin [Toggle]: Shows only when you have multiple 3D viewports, if it's not there, it means you're on one single viewport, it pins the DrDebug Menu to the active viewport to stop it from teleporting to the other viewports
- Split Screen Scalpel [Toggle]: Available on supported debug modes. Enables a buttery-smooth, draggable split-screen slider, allowing you to instantly compare the raw debug math against your lit scene. (Fully supports multi-viewport setups).
- Performance Mode [Toggle]: Working on a massively heavy scene? Reading real-time pixel data can be demanding. Performance Mode optimizes the data readers so they only update when you move your camera, saving your frame rate when static.
- Drag [Hold]: Click and hold here to freely drag the DrDebug menu anywhere inside your viewport.
2.2 - Expand Button
A simple toggle to expand or collapse the main menu, keeping your viewport clean. You'll find similar mini-toggles on individual sections (like "Exposure & Lighting") to hide tools you aren't currently using
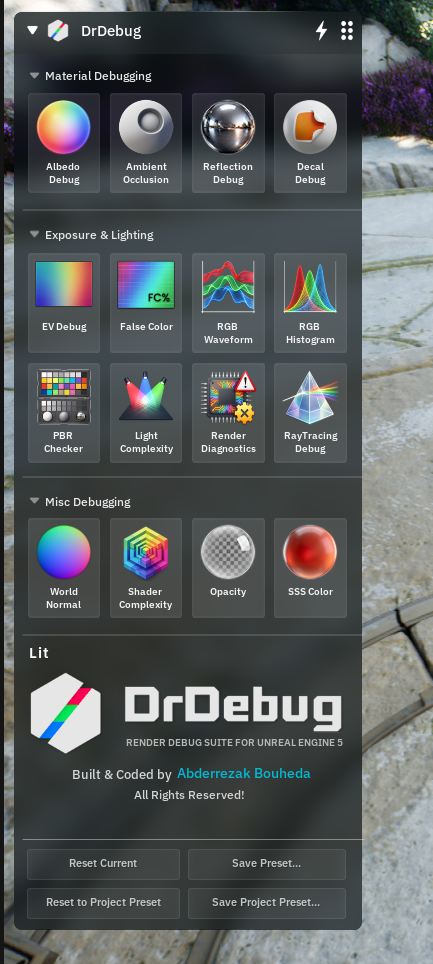
2.3 - Debug Modes
Each diagnostic tool is represented as a button. Toggling a mode automatically injects the correct rendering override.
- Note: The PBR Checker is independent. It is a reference actor that physically follows your camera, meaning it can be toggled on or off regardless of which Debug Mode is currently active. (Detailed mode explanations can be found in the [Debug Modes Arsenal]).
2.4 - Settings Panel
When you activate a Debug Mode, its dedicated Settings Panel appears. This is where you control the tool—adjusting switches, sliders, and color ramps.
- The Crosshair: DrDebug reads the exact pixel data at the dead-center of your screen (under the crosshair) and feeds that mathematical data live into this panel.

2.5 - Presets
Stop rebuilding your studio standards every time you open the engine. The preset system manages your workflow:
- Reset Mode: Reverts the currently active debug mode back to its factory default settings.
- Save Preset (User Preset): Saves your exact tweaks for the currently active debug mode. (Next time you open DrDebug, this preset will load automatically each time).
- Save Project Preset: Saves your entire global setup across all modes except User Presets (It won't override them). (Next time you open DrDebug, this global setup will load automatically). YOU NEED ADMIN MODE to Save Project Preset (see explanation in next page)
- Reset to Project Preset: Reverts everything back to your saved global setup, except for any specific modes where you have saved a custom "User Preset".
Example Workflow:
- You set up your custom ramps in Albedo Debug and Reflection Debug, and click "Save Project Preset". This is now your studio standard.
- Later, you are working in Albedo Debug and drastically change the sliders for a specific test. You click "Reset Mode", then do your changes, "Save Preset" (creating a User Preset just for Albedo).
- If you click "Reset to Project Preset", all other modes revert to your studio standard, but your active Albedo Debug will safely keep its custom User Preset.
3.0 - Conclusion
This is the basic explanation for most of the crucial parts that need to be understood, next we'll go to the explanation of the debug modes & modes in general especially settings of Debug Modes.